The Australian recently reported “Electric car plans spark showdown”[1] with the article stating, “Liberal MP Craig Kelly, backed by Nationals MPs Andrew Broad and John Williams, would raise government support for electric cars at the next party room meeting and argue there should be no further subsidies given to the sector. It is not clear what subsidies Mr Kelly was concerned about because few have argued for subsidies for electric vehicles. It seems that the Federal Energy and Environment Minister Frydenberg had something different in mind: “.. what we will need to see is some of the infrastructure issues solved because when people come to make a decision about the vehicle they purchase they want to make sure that if they do purchase an electric vehicle that they can plug it in when they go on a long road trip and the infrastructure is consistent throughout the country”
The Minister appears to be arguing for proper planning in preparation for the inevitable rise of electric vehicles. However, the conservatives, having lost the debate over the future of coal-fired generation, seem determined to carry the fight to electric vehicles irrespective of facts. Why else would Mr Kelly be worried that “We need to be very careful that any subsidies or concessions we give to electric cars in Australia will not increase CO2 emissions rather than decrease them”, when up to this point, Craig Kelly hasn’t shown much interest in Australia’s emissions.
Whatever the reasons for the sudden concern about the rise of electric vehicles by the Right of the Australian Government and its supporters, the debate itself risks distorting the market’s response to the changing economics of electric vehicles, especially if it goes the way of the debate about Australia’s electricity supply and generation mix.
Hence to the topic of this paper – the future of Australia’s electricity supply and generation mix.
In an earlier paper[2], we explained how the market is driving the implementation of the technologies needed to reduce Australia’s greenhouse gas emissions. This is most clearly seen in the role of new cost, low emissions power generation technologies.
![]()
A trajectory for Australia’s generation mix and emissions intensity of electricity out to 2050
The analysis is based on two key premises discussed in the earlier paper:
- The unit cost of electricity for new solar farms and wind farms is already well below the unit cost of electricity from a new coal-fired power station.
- The additional cost of gas-fired generators to provide firming capacity for low cost variable renewable generators does not result in the total cost of wind/solar firmed by gas-fired generation exceeding the cost of new build coal-fired generation.
Note that these two cost comparisons exclude any consideration of a carbon price or equivalent. We also assert that these premises about relative costs are not assumptions, but current reality[3].
As the economics of energy storage improve, more of the firming capacity will be taken up by batteries, further reducing the volume of fossil fuels (in this case, natural gas) used for power generation. The technical performance of batteries for firming has already been clearly demonstrated by South Australia’s 100MW battery. [4]
The evolution of the generator fleet
Power generation in Australia is dependent on old, low efficiency coal-fired power stations[5]. Over the next two decades, most of these coal-fired generators will be retired[6], see Table 1. The date of withdrawal for each power station is either the announced retirement date or the result of the application of the ‘50-year retirement rule’. The volume withdrawn is the total amount of electricity generated by the power station in 2016. The retiring coal-fired power stations will be replaced by the cost-effective low emissions alternatives.
Table 1: Coal-fired capacity to be withdrawn
|
Decade ending |
Volume withdrawn (TWh) |
|
|
Black coal |
Brown coal |
|
|
2020 |
4 |
13 |
|
2030 |
23 |
12 |
|
2040 |
47 |
|
|
2050 |
19 |
24 |
|
2060 |
20 |
|
The evolution of Australia’s generation fleet will be influenced by other, additional factors. These include requirements for grid stability and the demand for electricity.
The demand for electricity determines the total generation capacity that must be installed. Forecasting Australia’s demand for electricity in 2050 is challenging. Table 2 shows projections of future power demand based on two separate approaches. One looks at projecting ‘business as usual’ and the other pre-supposes a gradual improvement in the ratio between GDP and electricity demand (the ‘electricity productivity’) so that the electricity productivity in 2030 is double that of 2010. This will require an uplift in the rate of improvement of electricity productivity by around 40%.
Table 2: Trends in electricity consumption (TWh)
|
Scenario |
2014 |
2020 |
2030 |
2040 |
2050 |
|
Business as usual |
248 |
258 |
268 |
276 |
283 |
|
Doubling electricity productivity |
248 |
242 |
228 |
211 |
196 |
Recent proposals for policies to manage the Australian power systems recognise the importance of stability and also acknowledge that the rise of variable renewable generation such as wind and solar introduce new challenges. While the purpose of this article is not to discuss the National Energy Guarantee[7], Energetics feels that the NEG may be seeking to solve tomorrow’s problems with yesterday’s thinking, and as such will perpetuate the systemic problems in the management of Australia’s power systems. Our modelling of the future generation fleet addresses the requirements of the NEG by specifying the mix of renewable and dispatchable generation that replaces the retiring coal-fired power stations. Initially that dispatchable generation is biased towards gas turbine generators but over time, we expect to see the dispatchable component taken up by storage technologies such as batteries and pumped hydro. For instance, a recent study[8] that looked at Ireland’s electricity system demonstrated that capacity of batteries to stabilise a grid is significantly smaller than the capacity of gas turbine generators to perform the same task.
Our analysis does not specifically address the impact of the electrification of transport. Electric vehicles will have two impacts; EVs will increase the demand for electricity and they will introduce a very large volume of battery storage into the networks. Our preliminary analysis suggests that the volume of additional storage that comes with the EVs is the more important issue and if managed correctly will see EVs as a positive development in the context of Australia’s electricity networks.
Table 3 and Table 4 present some results.
Table 3: Electricity in Australia – Business as usual projection of electricity productivity
|
2015 |
2030 |
2040 |
2050 |
|
|
Emissions due to the use of electricity (Mt CO2-e) |
189 |
147 |
112 |
61 |
|
Electricity generated (TWh) |
252 |
268 |
276 |
283 |
|
Intensity - all electricity (t CO2-e/MWh) |
0.75 |
0.55 |
0.41 |
0.22 |
|
Intensity - grid electricity (t CO2-e/MWh) |
0.79 |
0.58 |
0.44 |
0.23 |
|
Renewable fraction |
14% |
33% |
48% |
64% |
|
Variable renewable fraction |
7% |
27% |
42% |
58% |
Table 4: Electricity in Australia – Higher EP projection of electricity productivity
|
2015 |
2030 |
2040 |
2050 |
|
|
Emissions due to the use of electricity (Mt CO2-e) |
189 |
133 |
96 |
43 |
|
Electricity generated (TWh) |
252 |
228 |
211 |
196 |
|
Intensity - all electricity (t CO2-e/MWh) |
0.75 |
0.59 |
0.45 |
0.22 |
|
Intensity - grid electricity (t CO2-e/MWh) |
0.79 |
0.62 |
0.50 |
0.25 |
|
Renewable fraction |
14% |
32% |
47% |
65% |
|
Variable renewable fraction |
7% |
24% |
38% |
56% |
Figure 1 shows the trend in emissions due to electricity generation
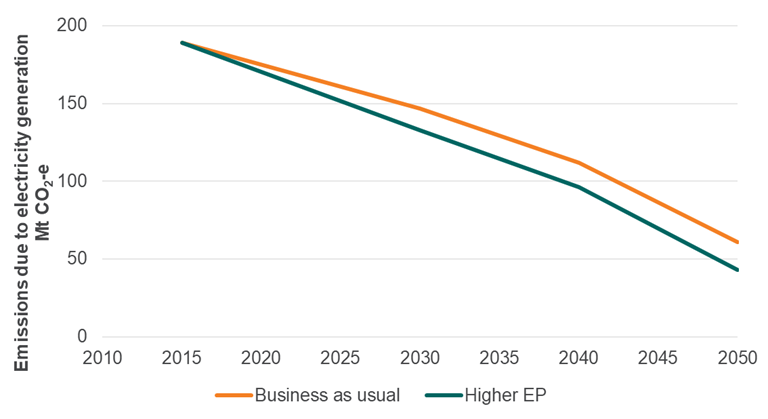
Figure 1: Forecast of Australia's trend in emissions due to electricity generation (2010 – 2050)
The trend is clear. Emissions fall, and the variable renewable component rises as the coal-fired power stations close.
What does this mean for policy makers?
If the business as usual trend for improvements in electricity productivity continues out to 2030 and if coal-fired power stations reach their 50-year life during the decade to 2030, and if these are replaced by wind/solar firmed by gas with some battery storage (as AGL is proposing for Liddell) then emissions due to electricity generation will be around 147 MT CO2-e. This equates to 25% below the corresponding figure in 2005 and is close to our commitment under the Paris Agreement. Two questions are raised:
- Why is the nation having a heated debate on the impact of the commitments to reduce emissions when business as usual will see electricity make its proportional contribution to the necessary reduction in Australia’s emissions?
- What happened to ambition to go beyond business as usual to reduce emissions?
Either improving electricity productivity above the business as usual trend or bringing forward the closure of certain coal-fired power stations (most notably Bayswater or Eraring) will see deeper cuts in emissions from electricity generation. The former brings with it the benefit of reducing costs to business. It may therefore be better for the nation to be debating the best ways to reduce electricity consumption rather than arguing over the structure of the generation fleet. The market will address the latter.
Perhaps now is the time for policy makers to turn their attention to emissions due to electricity in the period after 2030. The residual emissions after 2050 are largely due to the remaining coal fired power stations (12 MT CO2-e) and the gas fired generators (39 MT CO2-e). Much of this gas fired generation was introduced to firm the variable renewable generators. Perhaps now is the time to consider the appropriate technologies to meet the intent of the NEG (or equivalent policies) without a knee-jerk response of installing new fossil fuel fired generators to provide appropriate ‘dispatchable’ generation.
What business should be doing?
Our earlier advice stands. Renewable generation now provides the lowest cost electricity and businesses can take advantage by:
- exploring options for on-site renewable power generation; and
- entering into a power purchase agreement (PPA) with a suitable renewable energy developer.
References
[1] The Australian | Electric car plans spark showdown
[2] Energetics | In Australia’s climate wars, the market has already won
[3] Examples of levelised electricity costs for new build wind and solar were presented in our earlier paper.
[4] News.com.au | ‘That’s a record’: South Australia’s Tesla battery responds to coal-fired plant failure; The Conversation | A month in, Tesla’s SA battery is surpassing expectations
[5] Institute for Energy Economics and Financial Analysis | Sub Critical Australia Risks from Market Imbalance in the Australian National Electricity
[6] News.com.au | Dark future ahead for coal-fired power in Australia
[7] Energy Security Board Update
[8] Everoze | Everoze Launches 'Batteries: Beyond the Spin' Report on Digital Inertia
Related insights
Get our thought leadership directly to your inbox
Keep up to date with the latest insights on net zero, climate resilience and clean energy transition.