Asset owners and managers will play a critical role in driving the global transition to net zero. Many are already making public commitments to reduce their financed emissions and increase their investments in ‘green’ assets – with industry super funds taking the lead. The table below provides an overview of current commitments across the sector.
Table 1: Climate commitments of Australian super funds with >$50bn in assets under management (AUM). Source: Energetics’ research
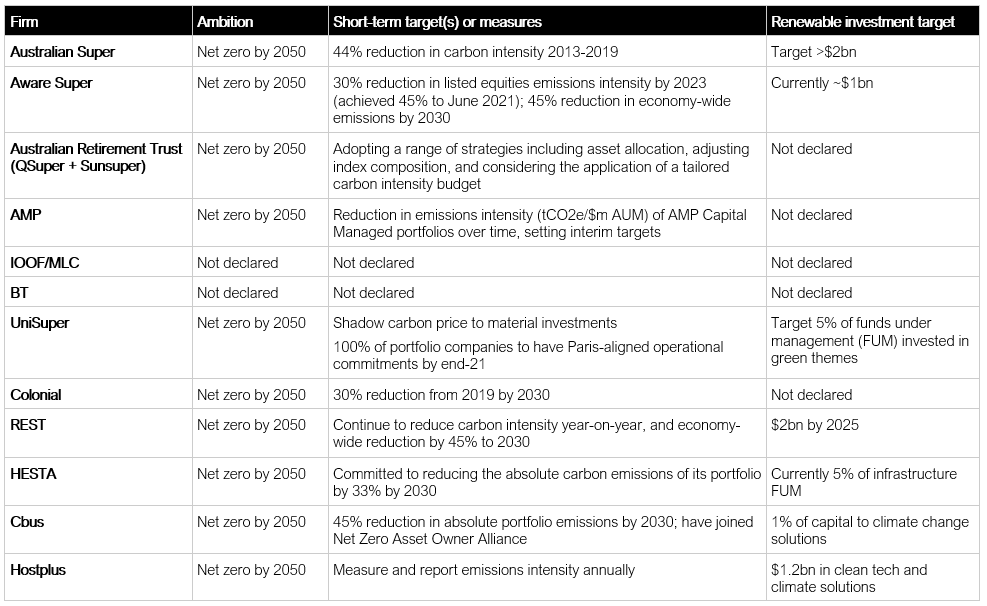
Looking through the table, a common, short-term metric is the emissions intensity of a super fund’s equities portfolio, measured in tCO2e/$m invested. Some investors have been making substantial reductions in emissions intensity – in the order of 40% over a five-year period.
But there is a catch.
In this article, the ‘catch’ is explored and the case made for investors to better understand the drivers of carbon intensity across a portfolio.
Profiling emissions through periods of growth and decline
Frequently, emissions are driven by a firm’s economic activity, with the best proxy being their revenues. In some cases, where firms do not publish their emissions, the use of an emissions factor may make this link explicit.
With easing monetary conditions over the past decade, valuation multiples have been expanding. As a result, equity valuations have been running ahead of sales (revenue) growth. The trend can be seen in Figure 1.
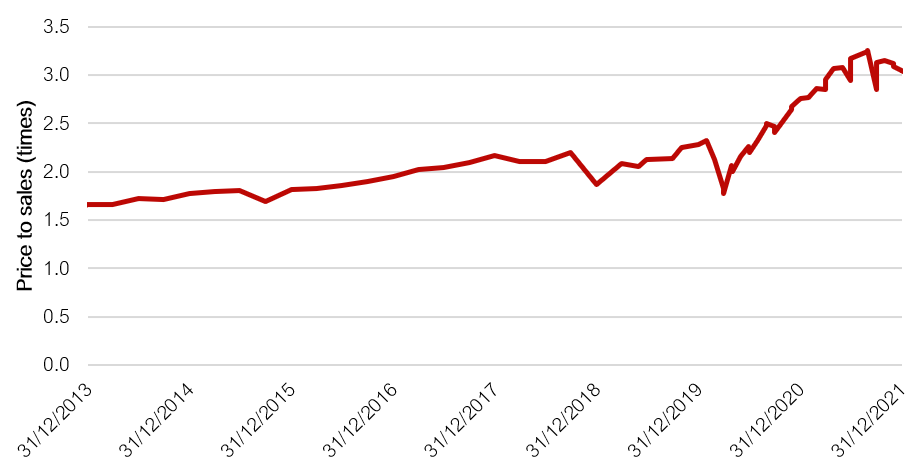
Figure 1: S&P 500 price to sales ratio
What we are seeing is that the revenue intensity of a portfolio (as measured on dollars of revenue per dollars invested), has been declining over the same period (see Figure 2). By proxy, even if tCO2e/$m of revenue remained unchanged, investors would have seen substantial improvements in their carbon intensity (when measured on a tCO2e/$m invested basis). A clear ‘tailwind’ for investors seeking to decarbonise their portfolios.
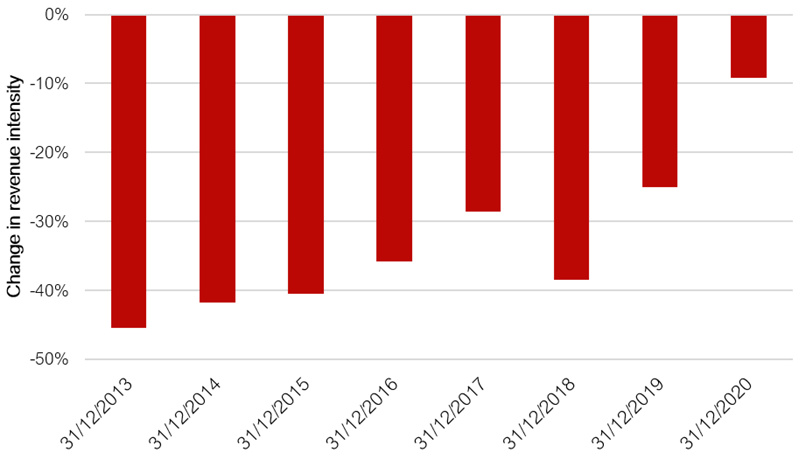
Figure 2: Change in S&P 500 revenue intensity ($ revenue per $ invested) over period to 31 Dec, 2021
Overall, the emissions intensity of the Australian economy in aggregate (measured as tCO2e/$ GDP) is on a downward trend, according to the latest National Greenhouse Gas Inventory.
However, the decline lags behind the emissions intensity gains investors need (see Figure 3).
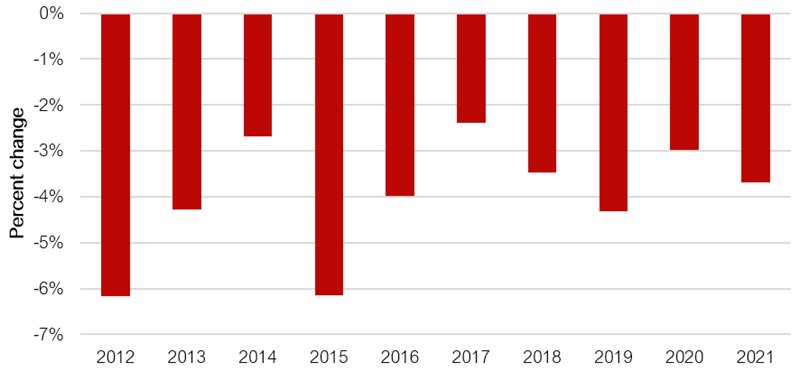
Figure 3: Annual change in Australia’s emissions per dollar of real GDP
Profiling emissions across sectors
There has been another tailwind for investors over the past few years. Carbon-light sectors such as technology and healthcare have led the market, while emissions-intensive sectors such as energy and industrials have lagged.
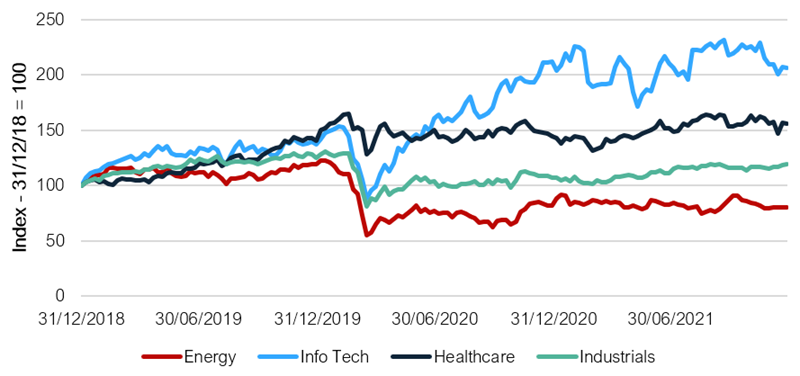
Figure 4: Relative performance of ASX 200 index components
This means that, even in the absence of strategic choices being made, the value of investments in these carbon-light sectors has increased while the value of investments in carbon-intense industries is flat to down, helping to reduce the overall carbon intensity of the portfolio.
However, these trends are now in reverse.
The ASX200 energy sector has been up nearly 20% during 2022, while the tech sector is down more than 35%. Meanwhile, the revenue intensity of the S&P500 has increased around 25% over the past six months.
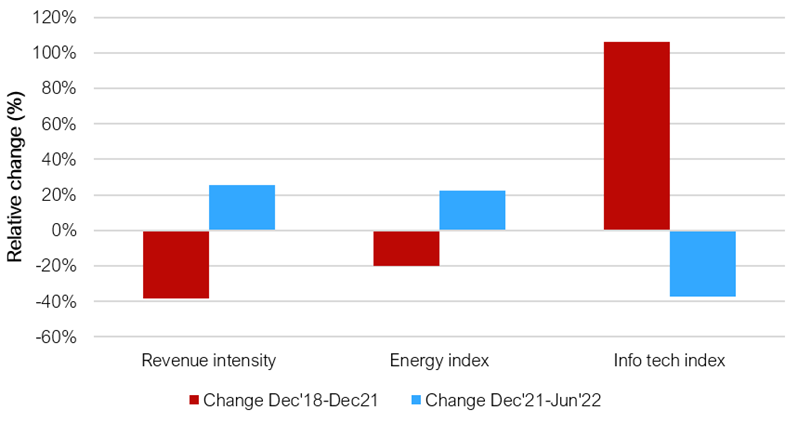
Figure 5: Comparison of carbon intensity "tailwinds" between Dec '18-Dec '21 and Dec '21-Jun '22 periods
What do these trends mean for investors?
First of all, unless they’ve made some pretty substantial changes, these trends will see the financed emissions intensity for investors increase this year, as the tailwinds become headwinds.
More importantly, investors will need to improve their understanding of what is really driving their carbon intensity and overall financed emissions – including a developing a granular knowledge of their portfolio companies. Partnering with a firm who has experience applying the PCAF (Partnership for Carbon Accounting Financials) standard can help investors accelerate this capability.
It also means that investors will need engagement strategies and select companies for their portfolio that are on a pathway to rapid decarbonisation. This may require expert advice to sort credible pathways from wishful thinking.
Finally, investors will need to explain to their stakeholders the journey they’re on, the choices they’re making, and set expectations that things won’t always move in a straight line. With ASIC’s announcement in March of enhanced scrutiny of greenwashing on financial claims, obtaining the right guidance is more important than ever.
Related insights
-

Business constraints and opportunities Is Australian business on track to achieve net zero?READ MORE -
Advice for boards Ready for net zero: what do organisations need to do between now and 2050?READ MORE -
CSIRO technical report What are the financial implications of a delayed transition to net zero?READ MORE
Get our thought leadership directly to your inbox
Keep up to date with the latest insights on net zero, climate resilience and clean energy transition.