I was recently asked this question by a CEO in the finance sector. My answer was an emphatic “yes”. I could say yes because it has been done and the team at Energetics did it. The work can be seen within the chapter on risk management in the Commonwealth Bank’s 2019 annual report.
Our ability to generate maps that show the impacts of a changing climate over time, the measures businesses can to take to adapt and evolve and the subsequent effects on productivity and profitability represents a profound shift in the way climate change is understood. In this article we outline the methodology behind our climate impact maps and how we were able to build them. We describe their value for risk management, insights into cost of capital and credit ratings, and the unique view they provide into strategic opportunities.
When we say, ‘climate mapping to 2050’, what do we mean?
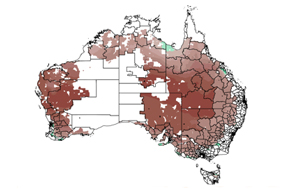 The maps consist of three layers of spatially orientated data: physical changes, economic factors and adaptation options. To build functionality for a business you need to combine high resolution spatial data (<25km grids) of climate data such as temperature and mean sea level out to 2050 (layer 1) with appropriate response data for whatever physical or economic system/sub-system the business operates in, such as wheat yield, human health, coastal erosion or insurance costs (layer 2). The third layer is the extent and feasibility of any climate adaptation that may be required.

The maps don’t, in themselves, exist as physical objects but as data layers within geographical information systems (GIS) and relational data bases. The sheer scale of the data and complex nature of the risk/response interactions make the construction of the maps a very demanding exercise.
One of the main reasons that these maps to 2050 can be created the exponential growth in the quantity, quality and accessibility of the necessary spatial datasets in the last few years. Governments around the world have embraced big data as a driver of economic innovation. The fact that a large majority of this core information is available in open source format from peer reviewed authorities and usually backed by nation state governments provides significant value in terms of transparency, comparability and trust.
Global financial institutions have noticed the enabling effect of the data. Several climate risk analytics firms have already emerged offering a range of data and analytic services to investors and financial analysts. Recently the global credit rating agency Moody’s announced that it has taken a majority stake in the climate risk firm Four Twenty Seven[1]. Moody’s has openly stated that it is planning to integrate climate risks into its credit ratings both for sovereign/sub-sovereign debt and bank debt[2].
Businesses should expect that credit agencies will conduct their own investigations and a business model that is seen to lack climate resilience will be marked down as riskier and attract a risk premium on its access to capital. This is not a trivial matter as more extreme weather driven by climate change is already having impacts on different sectors of the economy.
Purpose beyond disclosure
The Australian corporate regulator, ASIC, recently stated[3] that it has “updated its guidance in RG 247.66,to highlight climate change as a systemic risk that could impact an entity’s financial prospects for future years and that may need to be disclosed in an operating and financial review (OFR)”. The purpose of an OFR in the annual reports of listed entities is to set out information “that shareholders or unit holders would reasonably require to assess an entity's operations, financial position, and business strategies and prospects for future financial years”[4].
It is not difficult to see how a climate mapping to 2050 would contribute transparency and rigour to that process.
However, while businesses could use such mapping for disclosure, they are better used to inform planning and risk assessments. The true transformational power of our maps is the actionable information about future risks and opportunities that they provide. Where a business is at today is not really the point. Given time, assets can be sold, markets re-developed, and operations relocated. Answers can be found in the maps to questions of “by when?” and “to where?”.
References
[1] Bloomberg | Moody’s Catches on to Climate Risk Mispricing
[2] US Green Building Council | Moody's considers climate plans when determining local credit ratings
[3] ASIC | 19-208MR ASIC updates guidance on climate change related disclosure
[4] ASIC | RG 247 Effective disclosure in an operating and financial review
Related insights
Get our thought leadership directly to your inbox
Keep up to date with the latest insights on net zero, climate resilience and clean energy transition.