(article also published in RenewEconomy)
How well is Australia’s economy tracking to decarbonisation? The most recent update of Australia’s greenhouse gas inventory offers the opportunity to do two things. We can re-evaluate the emissions trajectory to 2030 and, as Australia’s inventory report is nearly 30 years old, extrapolate trends to form a view of business-as-usual emissions out to 2050. In this article Energetics presents the results and look at the sectors with the greatest decarbonisation challenges.
A look at national emissions through to 2050
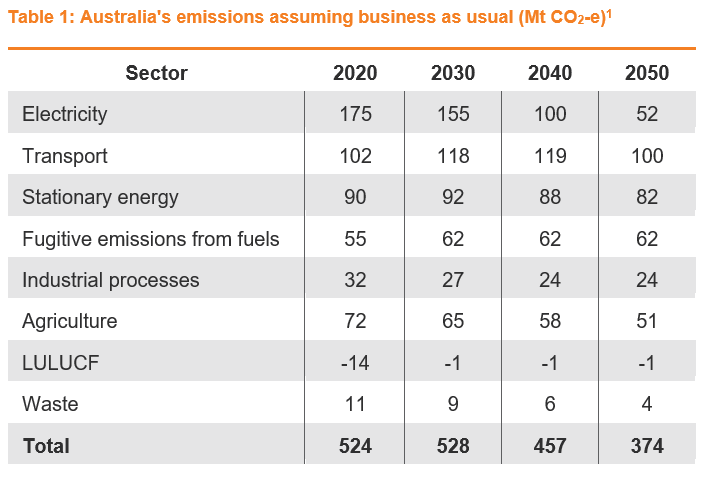
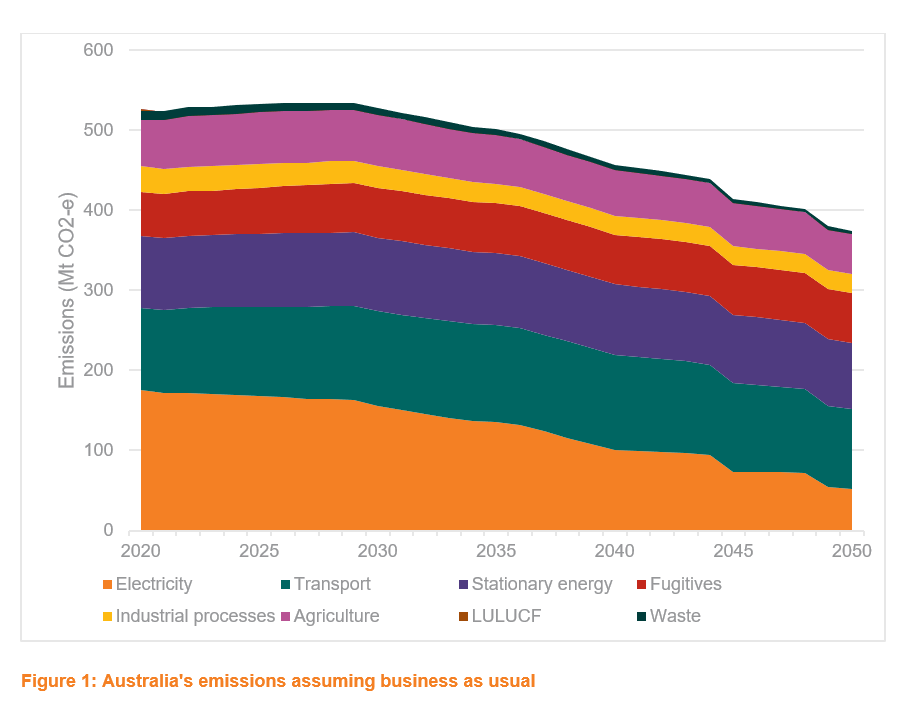
Energetics’ forecast of business-as-usual emissions is presented in Table 1 and plotted in Figure 1. What we see is that Australia falls well short of the target to reach 26% to 28% reductions by 2030 and is tracking in the wrong direction to achieve net zero emissions by 2050. At 528 Mt CO2‑e, emissions in 2030 are only 15% below the emissions levels of 2005. By 2050, emissions are 374 Mt CO2-e.


Our method for determining the emissions forecast can be viewed via this link.
Electricity will continue to decarbonise under business-as-usual
Focussing on the electricity sector, as the take up of wind and solar grows, emissions from electricity generation fall to 155 Mt CO2-e by 2030. Renewable generators will produce 43% of national electricity in 2030, rising to 50% in 2034. We also see that by 2030, fully scheduled generators (coal, gas and hydro) will make up 62% of the generation mix; exceeding the reliability target for the proposed National Energy Guarantee on a whole of Australia basis.
The impact of the closure of aging power stations on emissions from the electricity sector has been long recognised. What is new is the rise of corporate Power Purchase Agreements (PPA) and role that large energy users are playing in supporting investment in renewable generation. The Energetics' Corporate renewable energy PPA deal tracker shows how important they have become.
Emissions are growing across transport and stationary energy
The story is not so good for transport and stationary energy. Emissions from transport are expected to rise by 44% relative to 2005 and by 12% in the case of stationary energy. The growth in electric vehicles is important in constraining the increase in emissions from light vehicles, but they do nothing for heavy vehicle emissions and other transport modes.
We also see that the energy performance of the commercial and residential sectors with respect to stationary energy has been improving rapidly and it is the continuation of this trend that constrains the growth of emissions from stationary energy. Electrification and use of zero emissions gas for stationary energy applications have promise but given the time needed to establish these technologies, they are unlikely to offer major abatement before 2030. Stationary energy productivity (economic output/PJ of stationary energy applied) in industry has risen slightly in the three decades since 1990, however there has been a minor fall in recent years due to the commissioning of the new energy intensive LNG trains.
Land use change is the big unknown under business-as-usual
Finally, net emissions from land use and land use change are close to zero in 2030 and beyond. However, the absolute number is misleading as it is the balance between emissions sources such as land clearing and sinks such as reafforestation and improved management of soil carbon. A change in any one of the sources or sinks can result in a significant shift in emissions. Sequestration of emissions through management of soils and establishment of forests is viewed as an essential component of abatement in Australia but careful management is required if we are to have any chance of meeting our emissions reduction commitments.
National emissions targets and accounting tricks
We estimated that the business-as-usual cumulative emissions to 2030 are 584 Mt CO2-e above the cumulative emissions allowed by our 28% national reduction target.
The Australian Government has expressed a desire to use the carry-over from the Kyoto Protocol to help meet our commitment under the Paris Agreement. Our estimate of the carry-over is 397 Mt CO2-e, so should Australia be permitted to apply the carry-over units, our 2030 abatement task could reduce to 187 Mt CO2-e (for a 28% reduction target).
Given the concern about our 108% target for the Kyoto Protocol and the use of the ‘Australia Clause’ which allowed the inclusion of reductions in land clearing against the emissions target, the use of the carry-over units from the Kyoto target would undermine Australia’s reputation with respect to our genuine commitment to addressing climate change. Further, it will mean that we again defer the transformation to a low emissions economy and miss out on opportunities that stem from that transition.
But that is another story.
References
[1] ‘Business as usual’ assumes no new policy measures nor economic disruptions, particularly through the rise of new technologies. The forecast includes the impact of the Victoria Renewable Energy Target and Queensland Renewable Energy Target.
Related insights
Get our thought leadership directly to your inbox
Keep up to date with the latest insights on net zero, climate resilience and clean energy transition.

